Hystrix 服务监控:实时掌控分布式系统健康状态
Hystrix 不仅提供熔断、降级等容错能力,还内置了准实时监控机制,通过收集请求执行数据(成功 / 失败次数、响应时间等),以可视化方式展示服务健康状态。结合 Hystrix Dashboard 和 Turbine,可实现单服务到集群的全方位监控,帮助开发者快速定位性能瓶颈和故障点。
Hystrix 监控的核心组件
Hystrix 监控体系包含三个核心部分:
| 组件 | 作用 |
|---|---|
| Hystrix Metrics | 收集每个 HystrixCommand 的执行指标(成功 / 失败数、响应时间、线程池状态等)。 |
| Hystrix Dashboard | 可视化仪表盘,展示单个服务的监控数据(以图表形式呈现)。 |
| Turbine | 聚合多个服务的监控数据,支持集群级监控(解决 Dashboard 仅能监控单个服务的局限)。 |
Hystrix Dashboard:单服务监控
Hystrix Dashboard 通过图形化界面展示单个服务的 Hystrix 指标,直观反映服务的健康状态和调用情况。
集成步骤
(1)引入依赖
在需要监控的服务(如服务消费者)中添加 Dashboard 依赖:
1 | <dependency> |
(2)启用 Dashboard
在启动类上添加@EnableHystrixDashboard注解:
1 |
|
(3)配置监控端点
在application.yml中暴露 Hystrix 的监控端点(hystrix.stream):
1 | management: |
访问与使用 Dashboard
- 启动服务后,访问 Dashboard 界面:
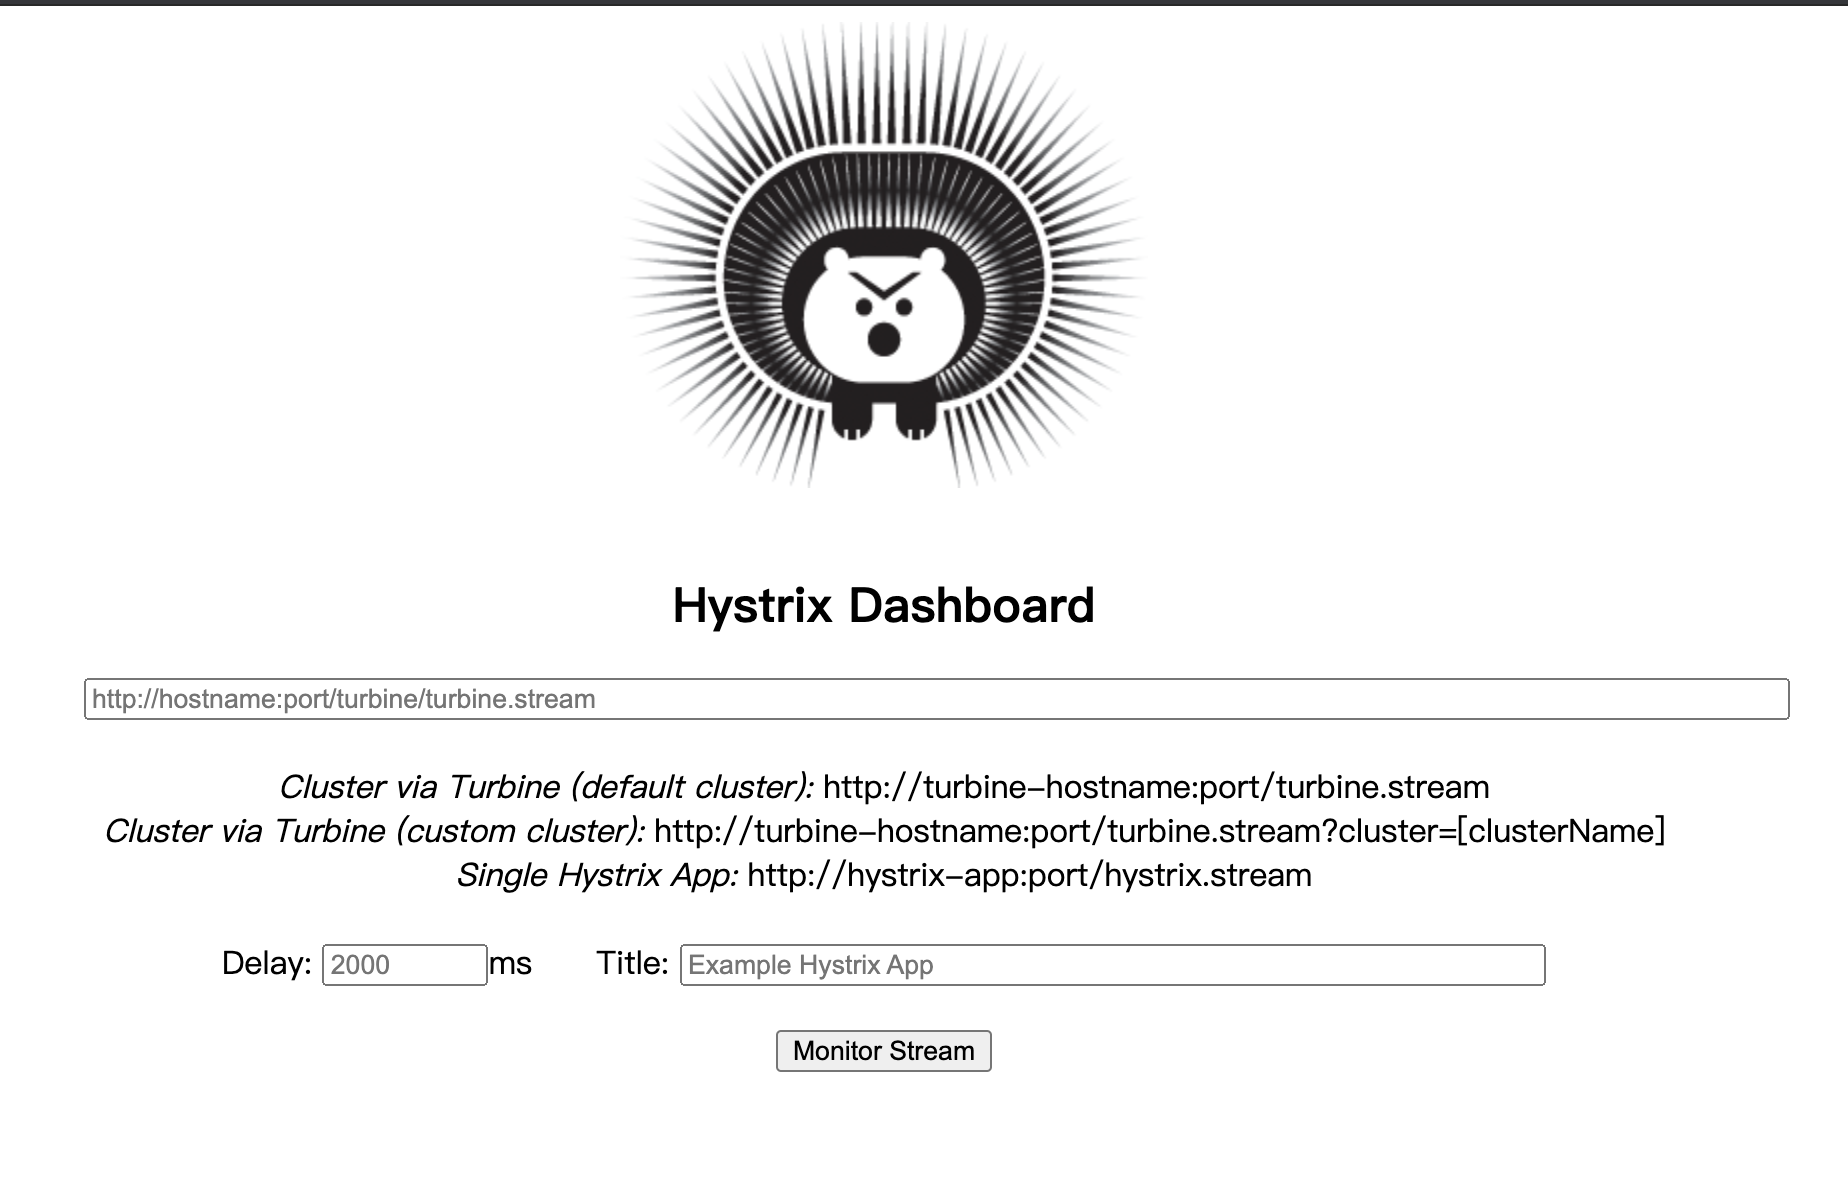
http://localhost:服务端口/hystrix 界面显示三个输入框:
- Hystrix Stream:需监控的服务的
hystrix.stream端点地址; - Delay:数据刷新间隔(默认 2000ms);
- Title:监控面板标题(自定义)。
- 输入监控地址:
例如,监控本地 8080 端口的服务,输入:http://localhost:8080/actuator/hystrix.stream
- 输入监控地址:
查看监控面板:
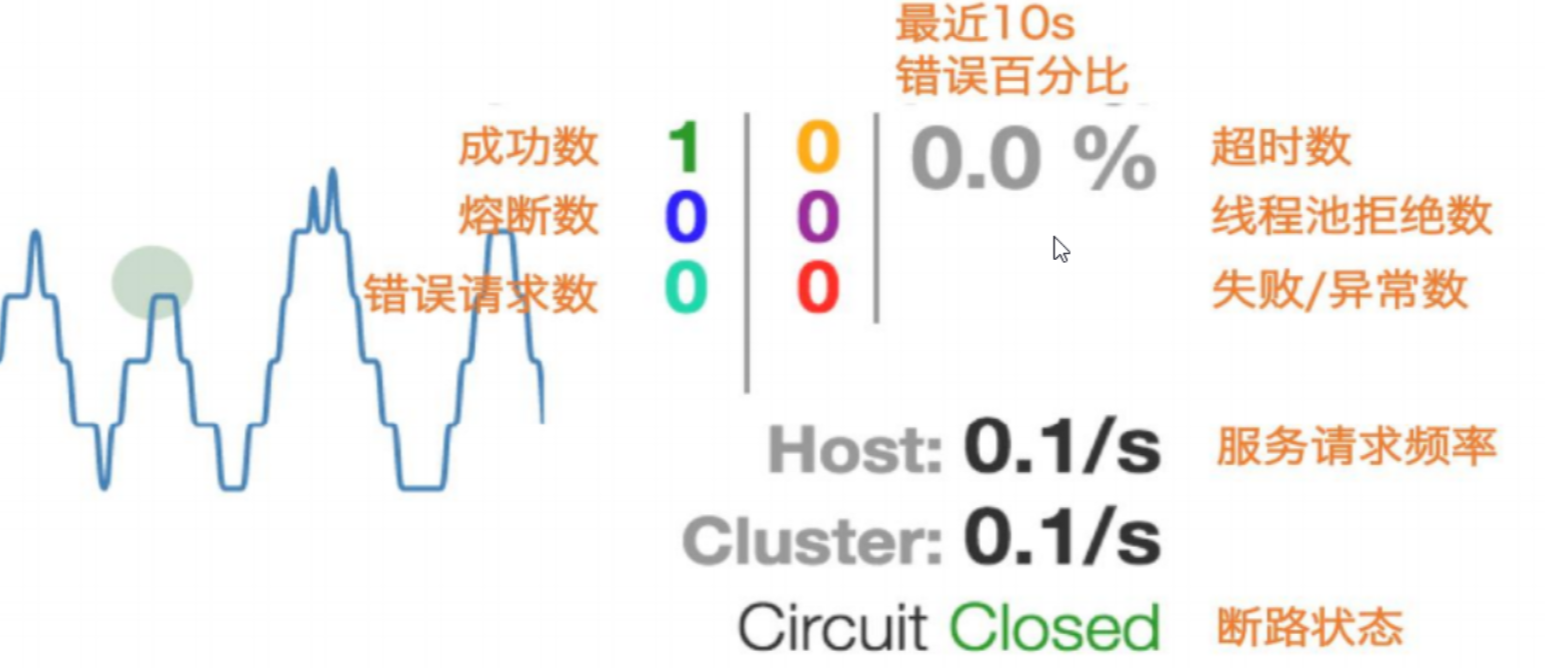
点击 “Monitor Stream” 进入监控页面,核心指标包括:![指标页面]()
- 实心圆:
- 颜色:绿色(健康)→黄色→橙色→红色(故障),代表服务健康程度;
- 大小:与请求流量成正比,流量越大,圆越大。
- 折线图:实时展示每秒请求数的变化趋势。
- 指标列表:
Circuit:断路器状态(CLOSED/OPEN/HALF-OPEN);Error%:错误率;Hosts:服务实例数量;Median:中位数响应时间(50% 的请求在此时间内完成)。
- 实心圆:
Turbine:集群监控
Hystrix Dashboard 仅能监控单个服务,而Turbine可聚合多个服务的hystrix.stream数据,实现集群级监控。
1. 集成 Turbine(传统方式)
(1)引入依赖
创建独立的 Turbine 服务,添加依赖:
1 | <dependency> |
(2)启用 Turbine
在启动类上添加@EnableTurbine注解:
1 |
|
(3)配置 Turbine
在application.yml中指定需聚合的服务列表:
1 | server: |
(4)使用 Turbine 监控集群
- 访问 Turbine 的聚合流地址:
http://localhost:8989/turbine.stream?cluster=default - 在 Hystrix Dashboard 中输入上述地址,即可查看集群整体监控数据。
2. Turbine Stream:基于消息中间件的集群监控
传统 Turbine 需配置服务列表,灵活性较差。Turbine Stream通过消息中间件(如 RabbitMQ、Kafka)聚合监控数据,服务无需预先配置,动态加入集群。
(1)服务端(被监控服务)配置
被监控的服务需添加依赖,将监控数据发送到消息中间件:
1 | <dependency> |
配置消息中间件地址:
1 | spring: |
(2)Turbine Stream 服务配置
创建 Turbine Stream 服务,添加依赖:
1 | <dependency> |
启动类添加@EnableTurbineStream注解:
1 |
|
(3)使用 Turbine Stream
- 启动所有服务(被监控服务、Turbine Stream 服务、RabbitMQ);
- 访问 Turbine Stream 的聚合地址:
http://localhost:8989/turbine.stream - 在 Hystrix Dashboard 中输入上述地址,即可监控所有发送数据到消息中间件的服务。
监控指标解读
Hystrix 监控面板的核心指标反映了服务的健康状态和性能瓶颈,关键指标包括:
| 指标 | 含义 |
|---|---|
| Circuit | 断路器状态:CLOSED(正常)、OPEN(熔断)、HALF-OPEN(尝试恢复)。 |
| Error Percentage | 错误率:失败请求占总请求的比例(超过阈值会触发熔断)。 |
| Requests per Second (RPS) | 每秒请求数:反映服务流量压力。 |
| Latency Percentiles | 响应时间百分位:如 P90 表示 90% 的请求响应时间小于该值(单位:ms)。 |
| Thread Pool | 线程池状态:活跃线程数、队列大小等(反映资源使用情况)。 |
注意事项
- 生产环境配置:
- 监控数据会占用网络带宽和系统资源,生产环境可降低采样率(如
hystrix.command.default.metrics.rollingStats.timeInMilliseconds=10000); - 为 Dashboard 和 Turbine 添加认证(如 Spring Security),避免未授权访问。
- 监控数据会占用网络带宽和系统资源,生产环境可降低采样率(如
- Turbine 与服务发现:
Turbine 需能通过服务发现(如 Eureka)找到被监控的服务,确保服务名配置正确。 - 替代方案:
Hystrix 已停止更新,推荐使用Sentinel Dashboard(支持集群监控、规则动态配置)作为替代方案。
总结
Hystrix 监控体系通过 Dashboard 和 Turbine,实现了从单服务到集群的全方位监控,帮助开发者实时掌握服务健康状态和性能瓶颈。其核心价值在于:
- 提前预警潜在故障(如错误率上升、响应时间变长);
- 快速定位熔断 / 降级原因(如依赖服务不可用);
- 为容量规划和性能优化提供数据支持